CoreLogic’s House Price Index (HPI) shows that the current market downturn became further entrenched in July. The national measure of property values fell a further -0.9% in July, taking the three month drop in values to -2.5%, the largest quarterly fall since October 2008 (-3.4%), when the market was in retreat from the Global Financial Crisis (GFC).
CoreLogic NZ Head of Research, Nick Goodall, said demand remains constrained despite the easing of the CCCFA regulations in early July.
“Housing affordability remains significantly stretched despite values falling, with the combination of high prices, following a significant upswing in values, and increasing interest rates restricting the number of buyers who are able, let alone willing, to borrow the sums of money required to buy property,” he said.
“Loan-to-value (LVR) restrictions also sit at their tightest setting on record, with banks remaining below the allocated 10% speed limit. The increase in listings on the market over the past year or so has also switched pricing power towards buyers.”
Property values fell in July in each of the six main centres, with previously resilient Christchurch now joining the chorus of cities in the negatives (-1.6%).
Mr Goodall said “As we’ve been noting for some time now, supportive factors such as better affordability in Christchurch may mean that values and demand hold up better than the other main centres through this correction phase. But that doesn’t mean Christchurch will be immune from the downturn.”
The standout however, is the annual rate of change for the Wellington region, which dropped into the negatives for the first time in a decade (January 2012 -0.1%).
“This illustrates a remarkable turnaround after the annual growth rate peaked less than a year ago in October 2021 at 36.1%, but has since slowed and now fallen back to take the average value below the same time last year ($1.04m),” Mr Goodall said.
Weakness is evident across the Wellington region with Porirua (-4.6%) and Wellington City (-4.5%) showing the largest value falls over July, but all five main urban areas are seeing at least a -1.5% fall. Values in Upper Hutt are now -2.0% below the same time last year – the worst rate of annual change across the motu.
Aside from affordability pressures impacting values in the Capital (as with the rest of the country), a previously heightened presence of first home buyers, but now subsequent decline, may also be a factor in the sharper turn-around with this sector of the market most impacted by the latest tightening of LVR restrictions.
“A significant increase in development activity over the past two years, particularly in Lower Hutt and Upper Hutt, could also be a factor in recent weakness. Some buyers who stretched their budgets based on development potential may now find that potential may not be realised soon enough to make the sums work,” Mr Goodall said.
Values in Dunedin remain slightly above (1.3%) the same month last year, but fell a further -1.3% in July to take the cumulative fall since the start of the year to -5.8%.
In Aotearoa’s largest city, Auckland, values remain at least 7% above the same time last year, but quarterly falls of -4.0% or more in the most populous areas show the tide has turned here, too.
“With affordability unlikely to improve significantly while interest rates continue to increase, the outlook for values across the country is to follow a similar path to the first half of this year for the rest of 2022,” Mr Goodall said.
“The relatively controlled nature of this downturn is unlikely to ring alarm bells for those at the RBNZ especially after such a strong upswing in values prior to the end of 2021. Trying to get control of inflation, through OCR increases is likely to remain their number one priority for now.
“That probably means discussion of LVRs loosening is premature, with the RBNZ most interested in financial stability, increasing the share of lower equity loans would not be the prudent option, especially with values continuing to fall in many parts across the country, increasing the likelihood of borrowers falling into negative equity.”
However, Mr Goodall notes that this isn’t necessarily a huge problem provided that borrowers are employed and can still service the debt.
“Indeed, it’s probably worth noting that even if the LVR restrictions were loosened, they are unlikely to bring a significant lift in demand. The impact of loosening the LVRs while the market is increasing is very different to loosening them as the market is decreasing – even if borrowers could secure the funding, would they want to? With dented confidence and expectations of value falls to come, many would suggest not.”
Mr Goodall flagged a more likely scenario may be the introduction of debt-to-income (DTIs) limits at some stage in 2023, alongside a loosening of the LVRs. The RBNZ’s version of giving with one hand and taking with the other. This could better protect the market from both sides of the lending equation. LVRs shoring up the lender with greater capital against their loans, while DTIs would limit borrowers’ exposure to future market downturns.
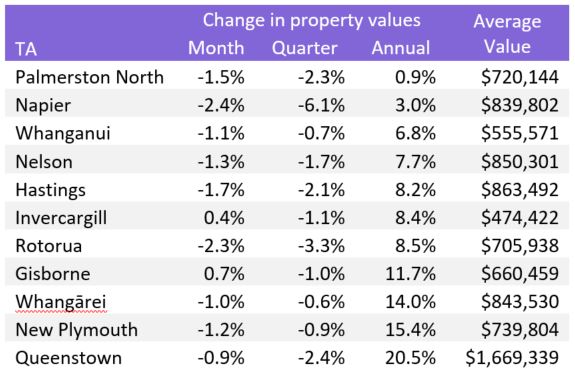
CoreLogic House Price Index – Other Main Urban Areas (ordered by annual growth)
Outside the main cities, all main urban areas have seen values fall over the last three months. In particular Napier values are down -6.1% since April to leave the average value only 3.0% above the same time last year.
In Palmerston North, persistent falls have left the average value only 0.9% ahead of the same time last year, to sit at $720k.
Weakness has crept into the Queenstown market, though the annual growth rate of 20.5% tells the story of a resilient and unique market, no doubt buoyed by the full opening of the New Zealand border at the start of this August.
Download the July CoreLogic House Price Index.

