First home buyers (FHBs) continue to maintain near-record market share even as they battle affordability constraints, according to CoreLogic’s August Housing Chart Pack.
The share of property purchases across New Zealand by FHBs increased to 27% in July, up from 26% in Q2 and well above the long-term average of 21%.
CoreLogic NZ Chief Property Economist Kelvin Davidson said FHBs are clearly taking advantage of the low deposit lending allowances being offered by banks.
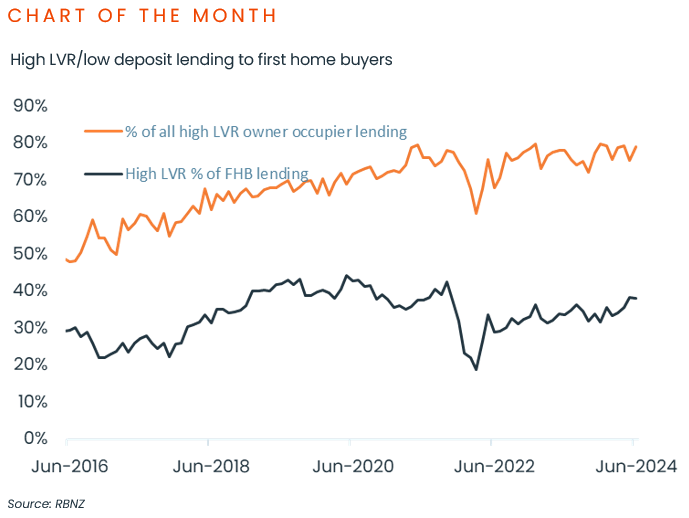
”Given the recent loosening in the loan-to-value ratio rules it’s interesting to see that FHBs currently absorb 75-80% of banks’ overall allowance for low deposit lending to owner-occupiers.
“Put another way, two in every five FHBs get into the property market with less than 20% deposit, and the RBNZ’s rate-cutting cycle is likely to reinforce their presence.”
FHB activity has been solid for several months now, and from January to July this year the group purchased more than 11,000 properties, up from around 9,400 in the same period last year.
At the same time, Mr Davidson highlighted the elevated available listings on the market as giving more choice for buyers in general, and FHBs in particular, which is also feeding into weakening price pressures.
“Total listings sitting on the market are around 25% higher than the same time last year, meaning many buyers can probably get a cheaper price and a better house than they thought.”
Certainly, Mr Davidson noted that property values have lost momentum.
“Across the main centres, Wellington remains with the largest decline from the peak, at 21%. Meanwhile, the smallest decline has been in Christchurch with values falling 7.1%, and also a market where the share of property purchases by FHBs is higher than the national figure, at 28%.”
Mr Davidson concluded: “Inflation is now trending back down to the 1-3% target band and as things stand there seems to be a reasonable chance that ‘typical’ mortgage rates could drop to around 5.5% by the end of 2025.”
“Undoubtedly, the major turning point for mortgage rates is here, and that will be a support for housing. But a fresh boom doesn’t seem likely when jobs are being lost and the economy remains in recession.”
August Housing Chart Pack highlights:
- New Zealand’s residential real estate market is worth a combined $1.62 trillion.
- Property values in NZ edged up 2.9% in the year to July, only due to a short burst of growth around the end of 2023/early 2024. Over the three months to July, the values dropped 1.9%.
- Indeed, NZ housing values have well and truly lost momentum, with the total drop from February’s ‘mini peak’ at 2.5%. Each of the main centres saw values fall in July, and a fair few of the provincial markets too.
- July sales volumes were 14.0% higher than the same month last year, which was a return to growth after a blip in June (-14.1%).
- There were 74,078 sales in the year to July, still well below NZ’s longer-term average of about 90,000 per year.
- There were 6,490 new listings over the four weeks ending 4th August.
- National rental growth has clearly settled into a more subdued phase, and was 2.5% in the year to July.
- Gross rental yields nationally now stand at 3.8%, which is the highest level since mid-2016, however still below term deposit rates.
- Around 64% of NZ’s existing mortgages by value are currently fixed and due to reprice onto a new mortgage rate over the next 12 months. That will generally involve a reduction in borrowing costs.
Download the August Housing Chart Pack
