Some of the main centres have seen small falls in property values over the past few months, but there's no reason to think that these drops will become more significant or sustained.
CoreLogic research analyst Kelvin Davidson writes:
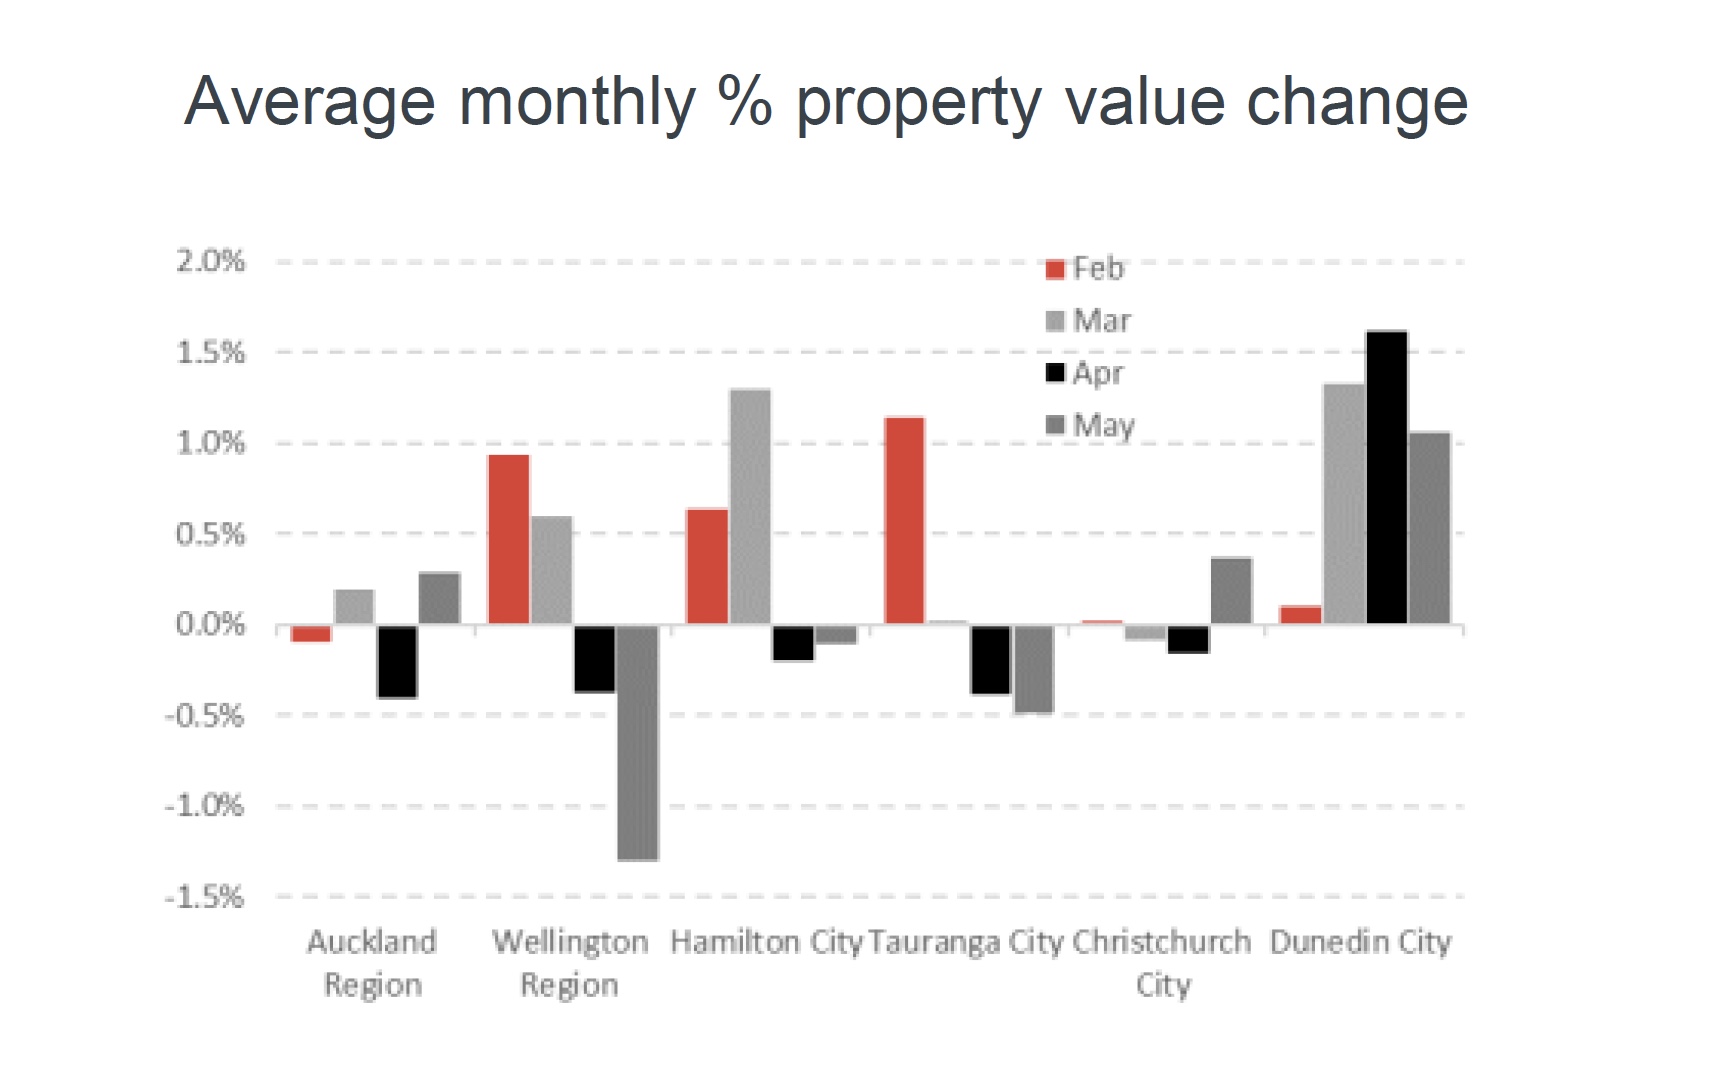
Since February, five of the six main centres have seen property values fall in at least two individual months. In Wellington, Hamilton and Tauranga, those falls have been consecutive in April and May. As the first chart shows, only Dunedin has sailed on unaffected so far in 2018 (with values up by 4.5% since December). Except for Dunedin, it seems clear that the high levels of prices around the country and tight serviceability criteria from the banks are slowing the market.

Now it's important to note that apart from the surprisingly sharp 1.3% dip in Wellington values in May, the other falls seen around the main centres have been small (<0.5%). And with the economy ticking over nicely, the labour market strong, and mortgage rates unlikely to rise to any meaningful degree for at least another 12-18 months, nobody's predicting that the patchy slowdown across the country will transform into a widespread slump.

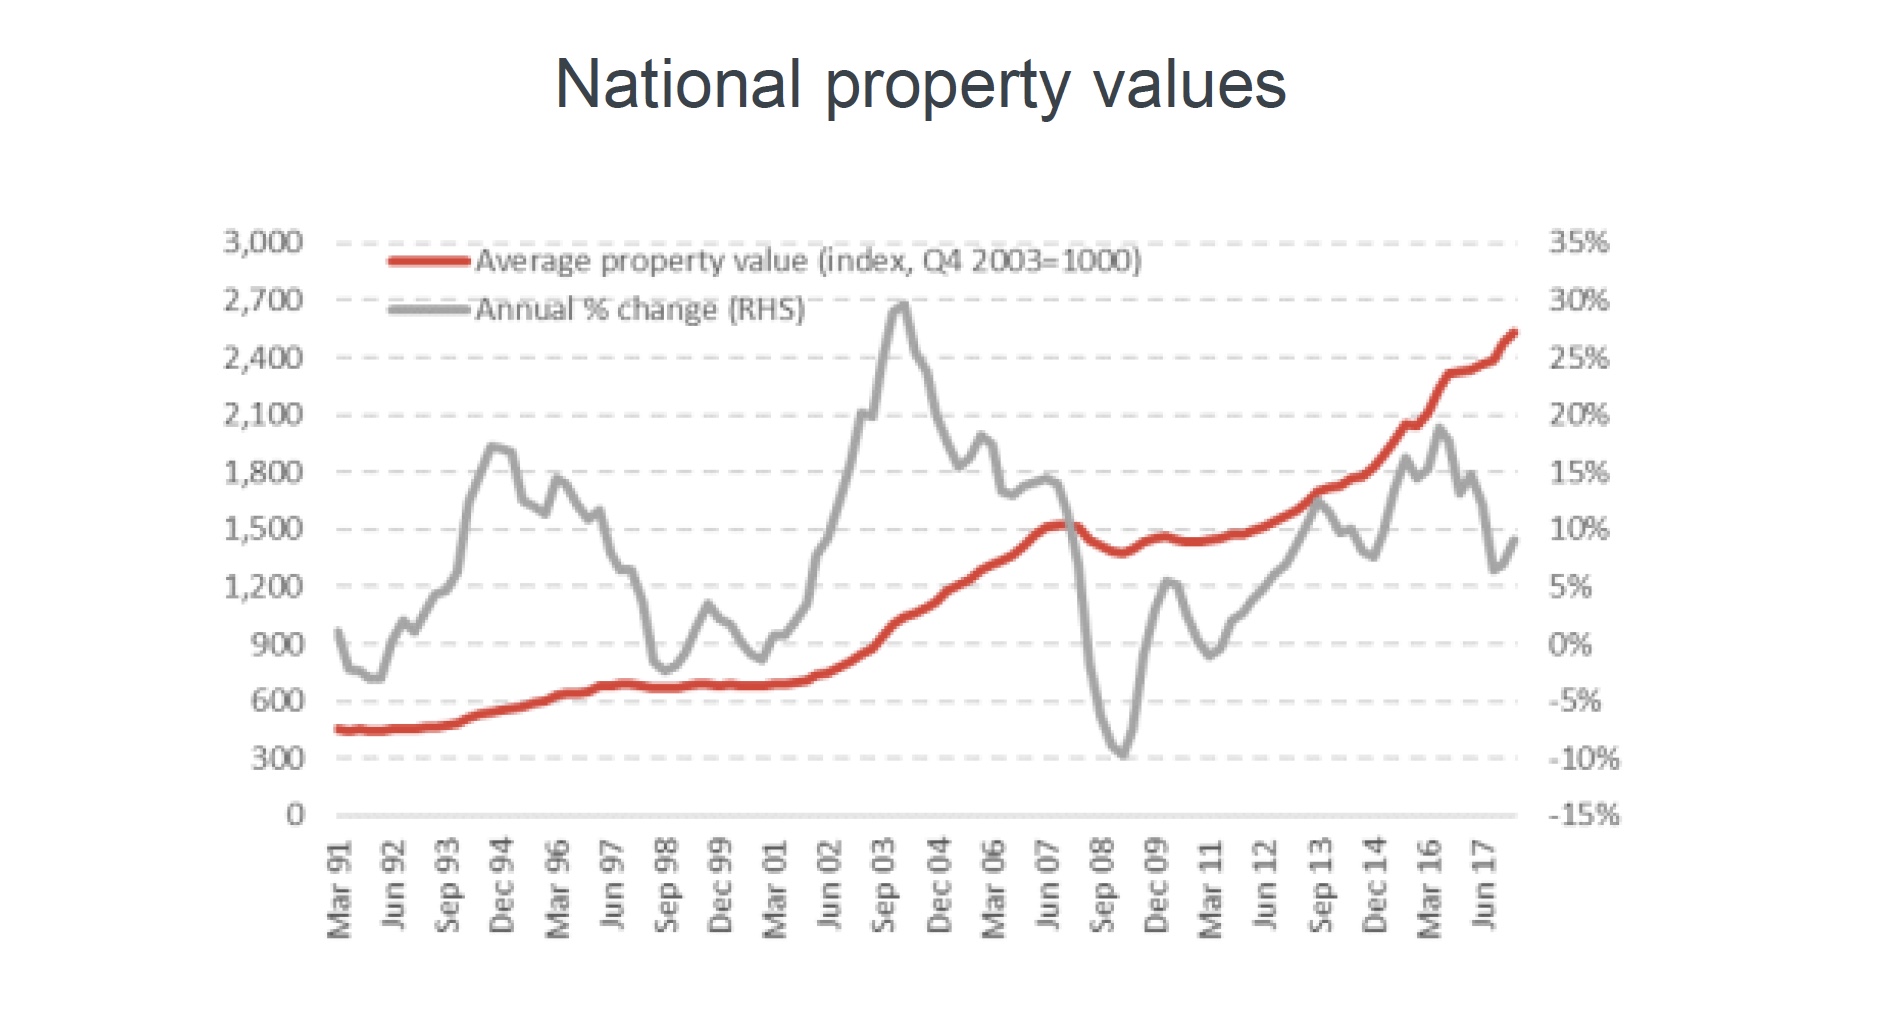
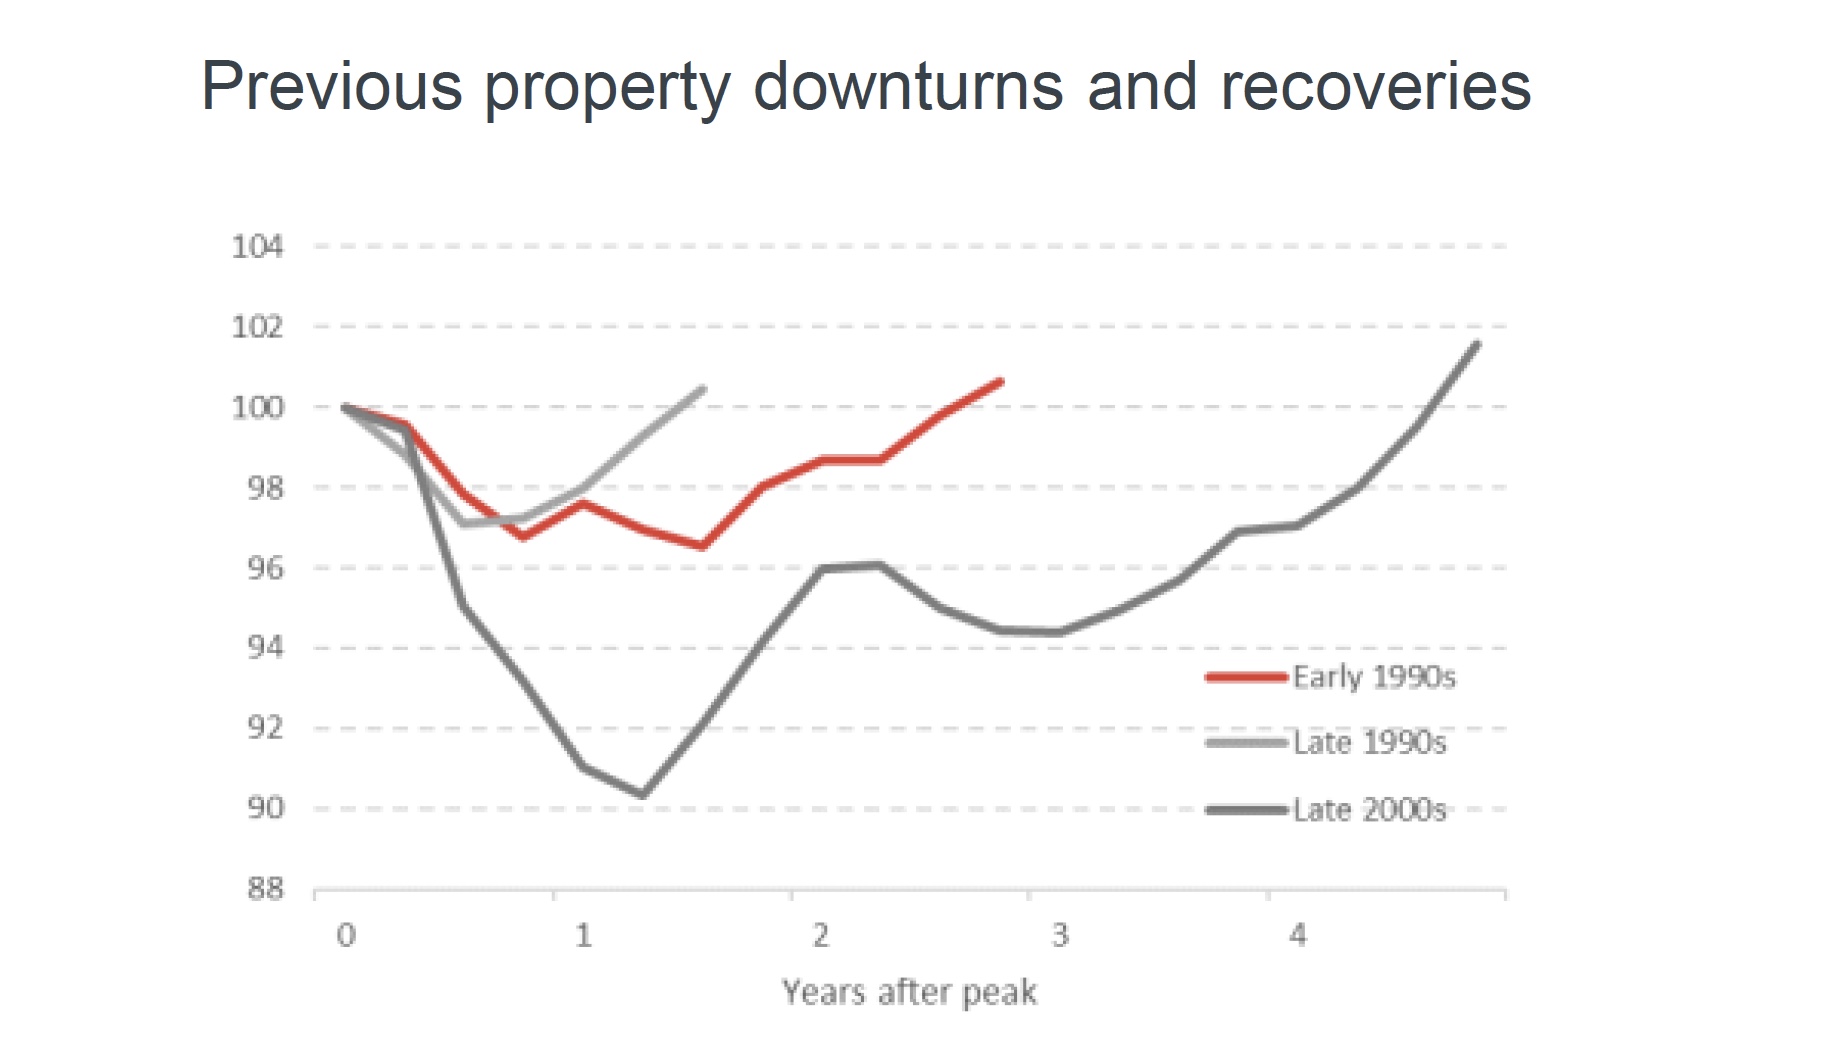
That said, it's always worth keeping an eye on history as a guide to what might happen if an unexpected shock did actually come along. As the second chart shows, we've had three main downturns since 1990, which broadly occurred 1990-92, 1998-2000, and 2008-10. These are shown in a different way on the third chart, with the cyclical peak for property values set at 100, then subsequent movements traced out.

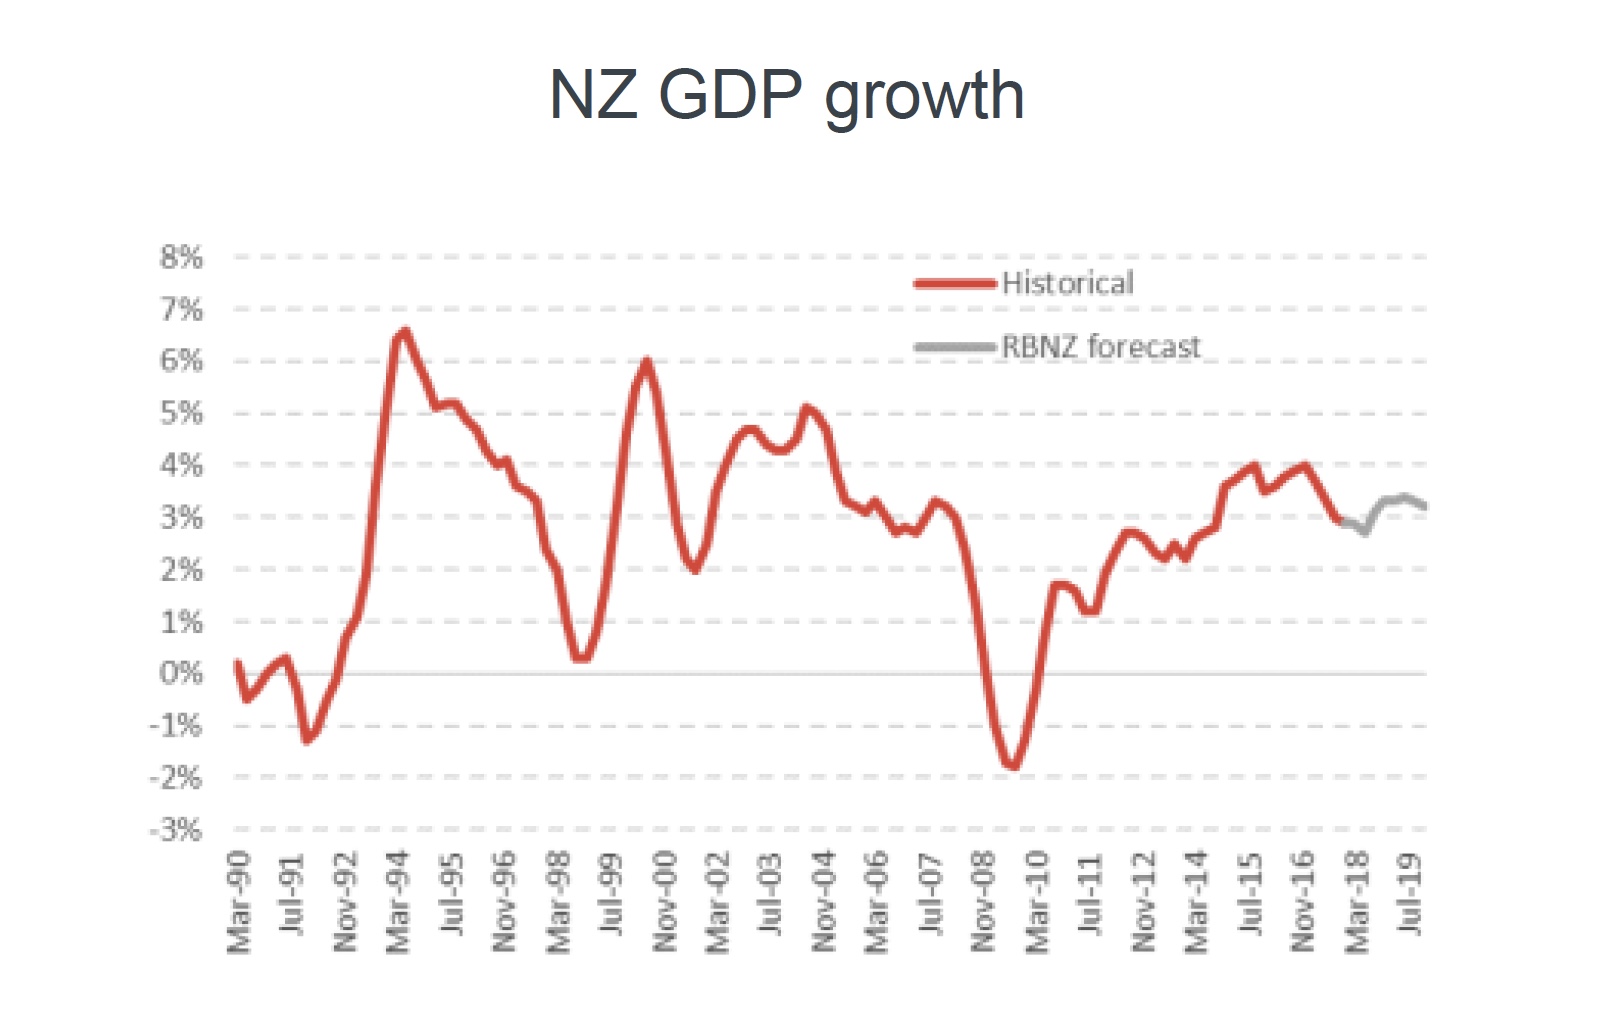
At the worst point in the early 1990s after about a 1½ years, values had fallen by almost 4%. It then took another year or so for them to get back to the previous peak. The Global Financial Crisis (GFC) related episode in the late 2000s was deeper, with values falling by 10% in around a year, with the previous peak not regained for about another three years. Both of those downturns in property values coincided with falling GDP, i.e. a recession (illustrated in the fourth chart). By contrast, the falls in residential property values in the late 1990s did not coincide with a recession - although it was a close call - and the downturn was shallower and shorter than the early 1990s or late 2000s.

So as a bit of scenario testing, what would happen to current values if history repeated? A 10% drop over the next 12-18 months (as was seen around the GFC) would push down average values by close to $68,000, from around $678,000 to $610,000. That's clearly a lot of money, but it's also worth pointing out that there's not actually a real loss until a property is sold. In addition, it would only return values to where they were as recently as August 2016. In other words, recent entrants to the housing market would be most vulnerable, particularly if unemployment started to rise significantly and/or mortgage rates increased sharply.
For now, however, those are only risks, not a central forecast. And even if they did come true, the short analysis of history in this Market Pulse suggests that it might take a very major upset (e.g. another GFC) for values to fall by any more than 4-5% on average across the country.
