It's now two years since the pandemic started in earnest in NZ, with our first case on 28 February 2020, borders closed to non-citizens/residents on 19 March, and the first full alert level four lockdown at 11:59pm on 25 March.
It's been a bizarre period for the housing market ever since, with initial predictions of significant rises in unemployment and large falls in property values turning out to be way off track. Indeed, after an initial four to five month period of housing uncertainty, the policy changes that were aimed at supporting the real economy – e.g. official cash rate cuts, quantitative easing, wage subsidies – also indirectly boosted the property market. Of course, direct measures such as the removal of loan to value ratio speed limits also played a key role, and since August 2020 the average national property value has risen by 41.6%, or $307,245.
By territorial authority area, three have seen post-COVID growth in average values in excess of 60% (Wairoa, South Wairarapa and Tararua), another 16 have had increases of at least 50%, and only one has been less than 25% (MacKenzie at 16.4%). In other words, it's been a large and synchronised boom, reflecting common drivers, including low mortgage rates and tight listings.
Of course, that upswing is now quickly giving way to a sharp slowdown, and as affordability constraints bite, mortgage interest rates rise, and credit availability tightens, outright falls in property values in some parts of the country could well be on the cards in the coming months. In other words, we now seem to be quickly shifting into a ‘buyer's market'.
However, the shape of the market over the next year or so is a topic for another day. In this Pulse we take a detailed look at the post-COVID experience so far, in terms of property value change by area and type, teasing out five key things we've learnt (or re-learnt) about property over that time.
First to set out the data. In this article for the area/type combinations below we use estimated median values across all properties in each group (from our internal bank-grade models), which is preferable to a sale price, as that can vary depending on the mix of properties which happen to be traded. We've also only looked at groupings where there was a large number of properties (ensuring no problems with a small sample size).
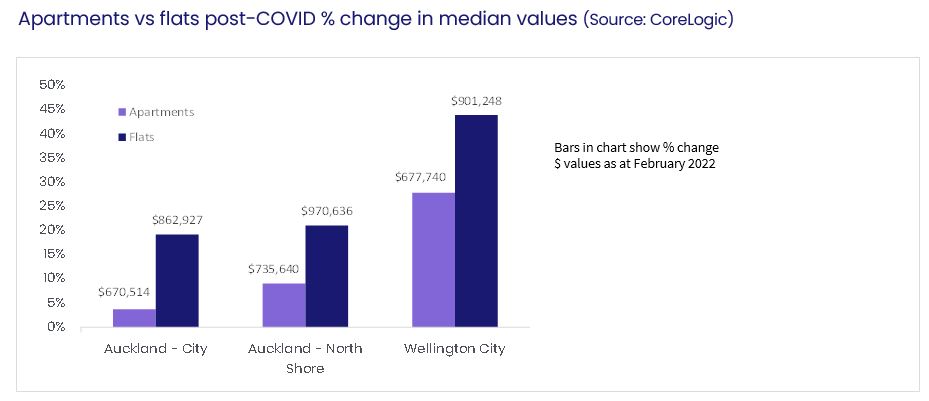
So what do the figures show? If we start with a simple comparison of apartments to flats, flats (think townhouses or terraced dwellings) have seen stronger growth in values. In fact, apartments in Auckland City, and the North Shore too, have been relatively subdued, only seeing growth in median values of 5-10% over the past two years*. That's likely to have reflected the particular pressures in those areas from the absence of foreign students and the weak short-stay accommodation market (without tourists). But in dollar terms, the levels are still pretty high – a budget of $700,000 would get you an apartment in Auckland City, but none of these other property types/locations. Indeed, a flat on the North Shore is now pushing $1m.

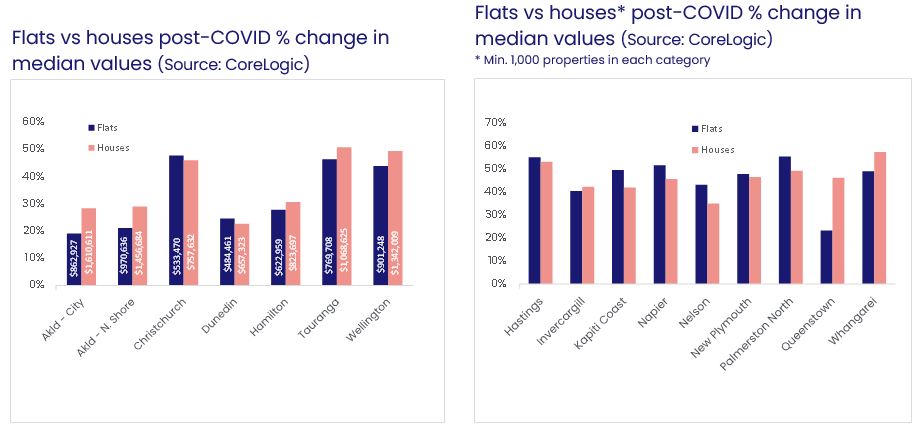
Switching to a comparison of flats to houses, it's generally the case across the main centres that houses have seen stronger growth – and also that Christchurch, Tauranga, and Wellington have been the most buoyant locations in absolute terms. However, that's not universal, with flats in Christchurch and Dunedin actually seeing slightly larger increases in median values than houses.
Switching to values themselves, for any given budget, a flat is going to be more attainable than a house, with the smallest value gap (Dunedin) still standing at more than $170,000. It's the only main centre where the median house value is still less than $700,000 (at $657,323), but flats are lower still, at $484,461. By contrast, in Auckland City, the increase (or value gap) to go from a flat to a house is far larger, at $747,684.
Around the main urban areas (i.e. the next tier of towns/cities outside the main centres), all have seen strong growth in values, regardless of property type – e.g. even Queenstown flats have gone up 23% – but there's been a more mixed post-COVID experience in terms of the relative growth for flats versus houses. In Whangarei and Queenstown, and to a lesser extent Invercargill, houses have outperformed flats. But the opposite has been true in Hastings, Napier, Kapiti Coast, New Plymouth, Palmerston North and Nelson.
So what has been learnt about property over the past two years, or at least re-learnt?
- Apartments often tend to lag behind the other property types, seeing smaller rises in value than houses (and flats) during upswings, and sometimes bigger falls in downswings. The reasons for this differ from cycle to cycle, but the end result is typically the same. In the post-COVID world, excluding apartments in Auckland City and North Shore, all other property types and locations have seen large increases.
- Housing market booms aren't necessarily always ‘good' for many owner occupiers, in particular those looking to trade up to a bigger property. For example, over the past two years, many would-be movers have been stuck where they are, either because they've had little suitable stock to choose from (listings low), or the financial/equity gap that needs to be closed in order to make the move has been too great, as the ‘next homes' have sometimes risen faster in value than theirs.
- Credit availability and cost matter more for the market over shorter horizons than other ‘fundamentals' like population growth or housing stock changes – indeed, without net migration in the past year or two, and with new housing supply also strong, property values have still soared. Why? We've had low interest rates and mortgages have been relatively easy to get, especially while the LVR limits were temporarily removed from April 2020 to March 2021.
- Low interest rates have a two-pronged influence on housing – making it cheap to borrow, but also reducing the incentive to hold cash in the bank. The post-COVID outflow of money from term deposits and into property highlights once again that kiwis need more ‘trusted' investment options, and perhaps carrots to look at them rather than sticks for property. For example, tax breaks on KiwiSaver deposits could be an option.
- Housing affordability measures help to tell us where the market currently sits (relative to history, and certain regions against others) and unaffordability is clearly a handbrake on price growth over time. But these measures don't necessarily tell us that the upswing will end when the house price to income ratio reaches X or years to save a deposit hits Y – nor how the adjustment back to ‘normal' will play out. Take years to save a deposit for example. It peaked at 9.4 in Q4 2016, a mark reached again in late 2020/early 2021. But the latest upswing then rolled on through 2021, simply extending that measure ever higher.

* We've only looked at these three markets here because they're the only areas with reasonable numbers of apartments.